
Commodity Market Review: Trade War Increases Pressure on Soybean Prices
Summary:
- The trade war between US and China has dampened soybean (SOYB) demand.
- Palladium (PALL) prices fall as investors seek safer investments
- I Know First commodities forecast performance
Soybean Prices Plummet; US Farmers Suffer

[Source: Pixabay]
The trade war between the US and China has placed tremendous pressure on soybean farmers. In July 2018, a 25% tariff was placed on American imports by China, in retaliation to US President Donald Trump’s economic tariffs on China for alleged “unfair trade practices”.
In spite of the truce that was agreed to in December 2018, which have helped recover some demand for American soybean exports, soybean demand has not fully reached pre-trade war levels. Imports for soybeans from January to March 2019 has been noted to have fallen by 14.4%, in comparison to the first quarter of 2018.
For a large industry that is experiencing falling demand and that has low margins due to the high fixed costs involved, the soybean market indeed seems bleak in the short term.
To alleviate the impact of the trade war as experienced by soybean farmers, the US has announced a US$16 billion package last week, which comprises $14.5 billion of direct market intervention payouts to farmers, and $1.4 billion in government purchases through school lunch programmes and local food banks.
However, government intervention is merely an artificial means to alleviate the impact of falling demand for soybeans. Until US-China relations improve, unsold soybean supplies may continue to depress prices.
For an export that was worth an average of 29% of US agricultural exports from October 2013 to October 2017 and that only represents 16% of US agricultural exports in October 2018, the latest trade war tensions may very well suggest that soybean prices may continue to drop in time to come.
On 19 April 2019, I Know First issued a bearish one-month outlook forecast for SOYB. On 20 May 2019, we see a 6.04% fall in the price of SOYB, in agreement with the I Know First forecast.

Palladium Prices Fall
Palladium is a rare metal that is commonly used in catalytic converters to reduce harmful emissions from vehicle engines. Other popular uses for it include jewellery and electronics.
Prices for palladium fell over a one month period, by about 6.60% from 19 April 2019 to 20 May 2019. This could have been motivated by the generally low trading volume in the palladium market, which has an average volume of 38,386. In comparison with gold (GLD), which has an average volume of 6,720,749, it is thus likely that during a sell-off, exasperation with the low levels of liquidity for PALL has thus resulted in a greater market response, thus resulting in significant pressure on PALL prices thereafter.
Furthermore, the S&P500, a common benchmark for the US market, has also experienced a drop of 2.23% in this period, which could be reflective of bearish sentiments towards the US economy due to the trade war. This may have increased investors’ preference for relatively more stable commodities like gold over riskier ones like palladium.
A similar bearish one-month outlook forecast was also issued for PALL on 19 April 2019. In good agreement with the I Know First forecast, PALL’s price fell by 6.60% in a one-month period.

I Know First Forecast Performance
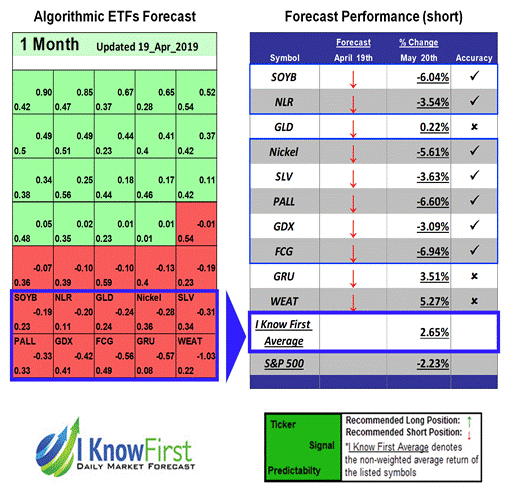
On 19th April, I Know First algorithm issued bearish predictions for commodities for a 1-month time horizon. The predictions include SOYB and PALL with negative signal of -0.19 and with predictability indicator of 0.23 for SOYB, and with negative signal of -0.33 and with predictability indicator of 0.33 for PALL . Over the 1-month trading period from 19th April to 20th May, SOYB fell by 6.04% and PALL fell by 6.60%, in good agreement with the I Know First forecast
This bearish commodities forecast was sent to the current I Know First Subscribers on April 19, 2019.
Algorithmic Stock Forecast: The table is a commodities forecast produced by I Know First’s algorithm. Each day, subscribers receive forecasts for six different time horizons. Note that the top 10 commodities in the 1-month forecast may be different than those in the 1-year forecast. In the included table, only the relevant commodities have been included. The boxes are arranged according to their respective signal and predictability values (see the link for detailed definitions). A green box represents a positive forecast, suggesting a long position, while a red represents a negative forecast, suggesting a short position
Please note – for trading decisions, use the most recent forecast. Get today’s forecast and top commodities picks.