
Oil Forecast: Crude Oil Drops As Supply Takes Over
Crude Oil Drops As Supply Takes Over
Demand’s Historic Impact On Crude Oil Prices
When China joined the World Trade Organization in December of 2001, crude oil’s price was about $26. Since China became open to world trade, the nation added total oil consumption equivalent to that of Japan and the U.K. China even surpassed the United States as the largest automobile market in the world in 2010. This increase in demand for oil caused the price to skyrocket to a value around $100, and until recently many economists assumed that China would eventually overtake the U.S. as the largest consumer of oil. These forecasts appear to be incorrect, however, as their increased demand for oil appears to be slowing as the country comes up against capacity constraints. Future demand in China looks as if it will be more price elastic, and the oil market is unlikely to find another source that can take over China’s role in increasing world demand. With their ability to continue as a source of increased oil demand in doubt, increased supply has become the main factor dominating the crude oil market.
Excess Supply Drives Crude Oil Prices Down
While the increased demand from China and other emerging markets used to be the decisive factor in the world oil market, surging U.S. supply along with additional supplies from Canada have caused oil prices to decrease, more than most oil exporters had anticipated. Since 2008, U.S. oil production has increased 80% to $9 billion barrels daily. This increase alone is more than the output of every member of the Organization of the Petroleum Exporting Countries, or OPEC, besides Saudi Arabia. For the past three years, prices for crude oil have hovered around $100. Increases in world demand have decreased due to China, and the increases in supply were counterbalanced by disruptions in countries such as Libya and South Sudan and sanctions on Iranian exports. In the past few months, it became apparent that the world economy was experiencing slower economic growth and Libya suddenly quadrupled output to a million barrels a day, causing oil prices to weaken in September before tumbling.

Source: Nasdaq
OPEC Decides Not To Intervene
Last week, OPEC announced that they had decided not to curb supply of crude oil, causing the price of crude oil to fall below $70, hitting a five-year low. Saudi Arabia and some of the other Persian Gulf countries blocked any attempts to cut output, as they did not want to lose any of their market share, particularly to Iran and Iraq. Instead, OPEC is waiting it out and allowing the oil market to correct itself. This could be seen as targeting the growing oil production in the United States, as their production is expected to grow another billion barrels a day this year. The shale industry has expanded rapidly due to artificially high oil prices and cheap lines to credit in the form of junk bonds used to finance drilling activities. The costs associated with this kind of drilling is much higher than that of the Middle Eastern countries, however, and the decreases in crude oil prices will probably cause many of these companies to either decrease oil production or shut down entirely.
Algorithmic Analysis
I Know First is a financial services firm that utilizes an advanced self-learning algorithm to analyze, model and predict the stock market. The algorithm produces a forecast with a signal and a predictability indicator. The signal is the number in the middle of the box. The predictability is the number at the bottom of the box. At the top, a specific asset is identified. This format is consistent across all predictions.

The signal represents the predicted movement direction or trend, and is not a percentage or specific target price. The signal strength indicates how much the current price deviates from what the system considers an equilibrium or “fair” price. The signal can have a positive (predicted increase) or negative (predicted decline) sign. The heat map is arranged according to the signal strength with strongest up signals at the top, while down signals are at the bottom. The table colors are indicative of the signal. Green corresponds to the positive signal and red indicates a negative signal. A deeper color means a stronger signal and a lighter color equals a weaker signal.
The predictability indicator measures the importance of the signal. The predictability is the historical correlation between the prediction and the actual market movement for that particular asset, which is recalculated daily. Theoretically the predictability ranges from minus one to plus one. The higher this number is the more predictable the particular asset is. If you compare predictability for different time ranges, you’ll find that the longer time ranges have higher predictability. This means that longer-range signals are more important and tend to be more accurate.
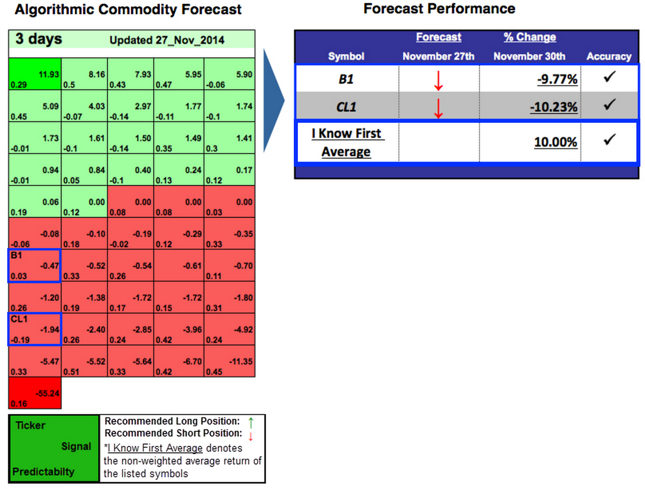
The figure above is an algorithmic forecast for oil from November 27th, 2014, for the three-day time horizon. The algorithm was bearish for oil, as two different oil indexes had negative signal strengths. The algorithm proved to be correct, as oil prices dropped 10% over the next three days, largely due to the announcement by OPEC not to limit the oil supply.
Future Outlook
Oil prices are likely to continue to drop until the supply corrects itself. Saudi Arabia and OPEC used to take correcting the oil market upon itself, and their decision not to this time represents a change in the market. OPEC appears to be retreating from the role as a swing producer, and is instead putting pressure on other oil companies with higher costs. Russia, the largest producer of crude oil, has said that they will not reduce production even if the price falls below $60. It might fall to American companies, as many of the shale companies cannot post profits as prices continue to fall. With OPEC no longer assuming the role, it might fall to America to act as a swing producer.