Coal News: Arch Coal Returns 72.29% in 30 Days as Predicted
Coal News: Coal Market Analysis With Arch Coal Forecast
Date: November 9, 2014
Arch Coal is an American coal mining and processing company. It is currently the second largest supplier of coal in the United States, following Peabody Energy who is currently the largest supplier of coal worldwide. The US is experiencing a transitions in energy consumption habits, such as Barack Obama shifting policies towards clean energy sources which emit zero to no carbon dioxide pollution. As of 2013 domestic coal consumption in the US was being displaced by natural gas; however, coal exports have been increasing.
The Environmental Protection Agency has been getting stricter in recent years regarding clean energy proposed rules. With Republicans victorious in the mid-term elections, it’s possible that Congress will “slow down EPA rules on coal,” a Strategas Research Partners analyst told Barron’s. The rules which have placed limitations on utilities coal usage might be loosened or repealed, potentially boosting coal industry revenues (which would justify the recent spike in coal related industry stock prices)
Underground mining requires little advancement in technology, and while more modern mining methods such as open cut and long walls have drastically reduced accident rates (and sometimes economic benefit), Chinese underground mining still dominates the coal market. Cheap labor cost and a huge workforce (an estimated 5 million people work in Chinese coal mining) have positioned them as the largest coal producer. These hardening conditions have made the US coal industry extremely challenging, causing many companies to report losses in recent years.

Source: InfoMine.com
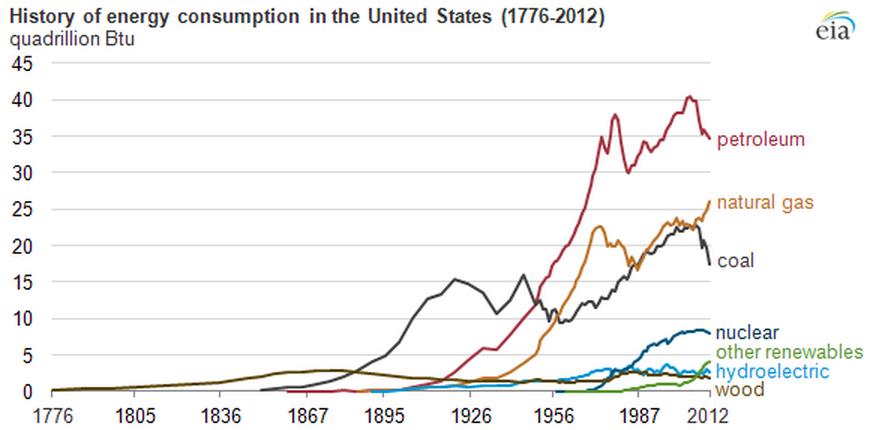
The declining prices since 2011 have brought on an efficiency race. Arch Coal and Peabody have been regularly closing wasteful mines in order to remain profitable (profit/ton). After a few unfavorable years, the overall coal market outlook is positive, due to expected price increase, demand increase, and efficiency increase. However, the rapid decline of the market size will position few firms able to compete, as growth in other markets such as renewable energy and natural gas continues to surge. This trend is clearly demonstrated in the chart below.
Source: US Energy Information Administration
Arch Coal
The algorithm predicts market perception towards an asset rather than the assets returns according to financial data. For this reason the algorithm was able to outperform all analysts, who usually make forecasts based on historical data alone. One month ago analysts published on Yahoo Finance and MarketWatch were completely undeceive towards Arch Coal Stock (check last month forecasts):
Yahoo Finance (Date Viewed: November 9, 2014)
MarketWatch.com (Date Viewed: November 9, 2014)
However, the algorithm picked Arch Coal as the strongest signal stock for both its small cap forecast and dividend stock forecast from October 9th, with an extremely strong signal of 91.68, and confidence level (predictability indicator) of 0.34.
Source: I Know First small cap forecast and dividend stock forecast : October 9th, 204
Following November 9th the Arch Coal (NYSE: ACI) stock appreciated by a staggering 72.29%:
Source: Forecast (Iknowfirst) Table: Yahoo Finance
Algorithmic Analysis (Explanation)
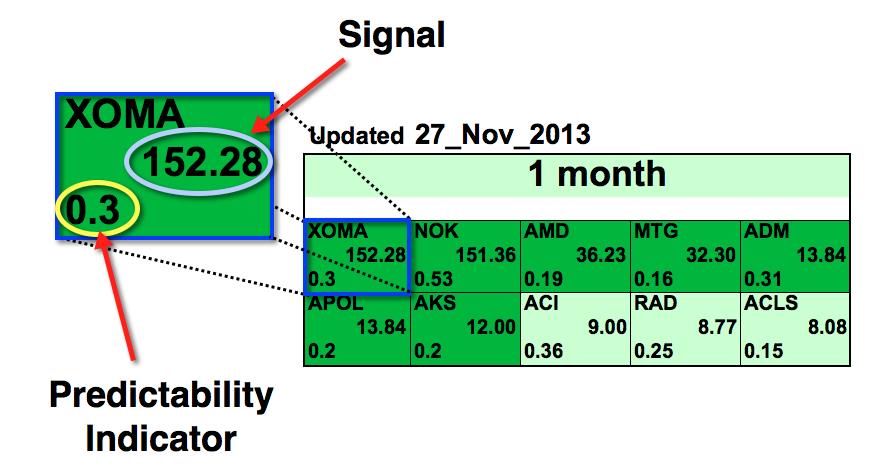
I Know First is a financial services firm that utilizes an advanced self-learning algorithm to analyze, model and predict the stock market. The algorithm produces a forecast with a signal and a predictability indicator. The signal is the number in the middle of the box. The predictability is the number at the bottom of the box. At the top, a specific asset is identified. This format is consistent across all predictions.
Signal Explanation
This indicator represents the predicted movement direction/trend; not a percentage or specific target price. The signal strength indicates how much the current price deviates from what the system considers an equilibrium or “fair” price. The signal strength is the absolute value of the current prediction of the system. The signal can have a positive (predicted increase), or negative (predicted decline) sign. The heat map is arranged according to the signal strength with strongest up signals at the top, while down signals are at the bottom. The table colors are indicative of the signal. Green corresponds to the positive signal and red indicates a negative signal. A deeper color means a stronger signal and a lighter color equals a weaker signal.
Analogy with a spring: The signal strength is how much the spring is stretched. The higher is the tension the more it’ll move when the spring is released.
Predictability Explanation
This measures the importance of the signal. The predictability is the historical correlation between the prediction and the actual market movement for that particular asset, which is recalculated daily. Theoretically the predictability ranges from minus one to plus one. The higher this number is the more predictable the particular asset is. If you compare predictability for different time ranges, you’ll find that the longer time ranges have higher predictability. This means that longer-range signals are more important and tend to be more accurate.
Source: Example of an I Know First algorithmic heat map.
In this particular Top 10 Stocks Forecast from November 27th 2013, XOMA had the strongest 1-month signal but did not have the strongest predictability. As the asset is in a deeper green color box, this indicates that the algorithm is very bullish.
The algorithm does not only predict the strongest signals, but also the weakest. If this is a market bubble the algorithm will be able to shift its prediction to a strong negative one, allowing investors to make gains on both the price appreciation and depreciation (by shorting the stock).
I Know First Research is the analytic branch of I Know First, a financial startup company that specializes in quantitatively predicting the stock market. This article was written by Daniel Hai, one of our interns. We did not receive compensation for this article, and we have no business relationship with any company whose stock is mentioned in this article.
Want to see similar returns in your portfolio? Test our algorithm and let us identify the best market opportunities for you. The above mentioned small cap and dividend forecast are but a small portion of I Know First Financial Services List.
To learn more about our product please use the following links
For information about private investor products click here
For information about institutional investor products click here
For the most recent I Know First Research articles and news click here
Want to know just how accurate our predictions are ? click here
Contact us with any questions: contact@iknowfirst.com
Are you the professional able to position I Know First as the top choice for today’s investor. Explore career opportunities available now to join our team: latest jobs.


